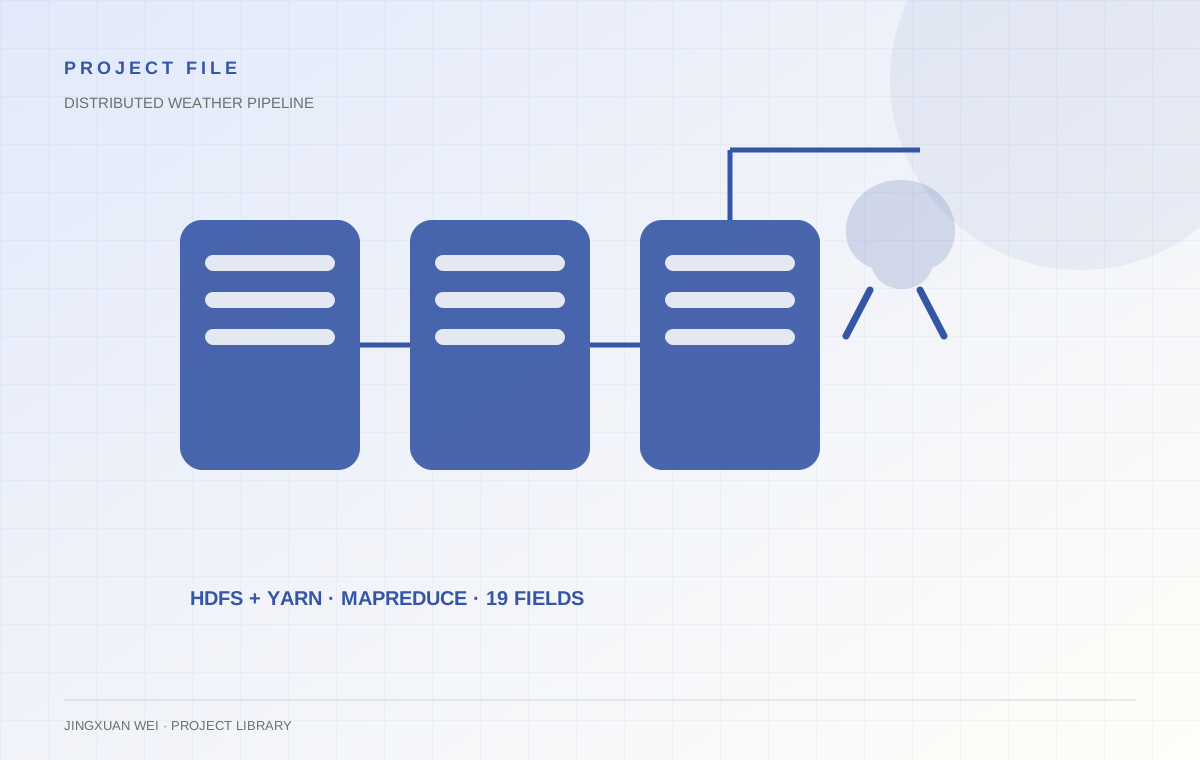
Multi-node Hadoop coursework for weather-data processing, HDFS/YARN deployment and visual analytics, with Python analysis and Java services included.
19
weather fields
31p
sanitized report
24m
forecast horizon
01 / Overview
What this package actually contains.
This project connected distributed storage, batch processing, time-series serving and forecasting in one weather analytics stack. The Hadoop and HBase reports show two different but complementary parts of the system: batch MapReduce analytics and low-latency historical retrieval.
Objectives
01Deploy a working HDFS/YARN environment for a weather dataset.
02Implement MapReduce jobs for cleaning, grouping and aggregate statistics.
03Connect the batch output to forecasting and visual analysis.
Data flow
From raw records to a usable service.
The pipeline is the main story: ingestion, storage, processing and serving.
01→
Weather records
Tab-separated station, date and measurement observations.
02→
HDFS
Distributed input and output storage.
03→
MapReduce
Mapper parsing, partitioner, grouping comparator and reducer.
04→
Aggregates
Year-level temperature results and derived statistics.
05
Analysis
Python correlation checks, SARIMA forecasts and dashboard views.
02 / Package highlights
What this work demonstrates.
Moves weather data through HDFS, MapReduce and a visual reporting layer.
Includes SARIMA forecasting and supplementary correlation analysis.
Bridges distributed batch processing with a usable operational dashboard.
03 / Implementation
Where the engineering complexity sits.
01
The map/reduce contract
The mapper converted raw text into a custom key containing year and temperature. Partitioning by year kept related records together, while the grouping comparator allowed the reducer to treat an entire year as one logical group. The reducer then emitted the highest-value record for that group.
The input format was a tab-separated date/temperature stream.
A custom writable comparable made the temperature part of the sort order.
Three reducers distributed yearly aggregation work across the cluster.
02
From batch output to forecast
The weather analysis did not stop at MapReduce. A separate Python workflow loaded monthly aggregates, tested stationarity, plotted historical trends and fitted SARIMA models for temperature and precipitation. This division kept distributed processing and statistical modelling independently testable.
04 / Key code
Code that defines the pipeline.
Only verified source excerpts and pseudocode taken from the project papers are shown.
Verified project codeJava
MapReduce job configuration
Original Java excerpt showing the reducer count, custom partitioner and grouping comparator.
myweather2/Run.java
Configuration conf = new Configuration();
Path inputPath = new Path("/myweather");
Path outputPath = new Path("/myweather_output");

Job job = Job.getInstance(conf, "yearly maximum temperature");
job.setInputFormatClass(TextInputFormat.class);
FileInputFormat.setInputPaths(job, inputPath);

job.setMapperClass(WeatherMapper.class);
job.setMapOutputKeyClass(WeatherWritableComparable.class);
job.setMapOutputValueClass(Text.class);
job.setNumReduceTasks(3);
job.setPartitionerClass(YearPartitioner.class);
job.setSortComparatorClass(TemperatureCompartor.class);
job.setGroupingComparatorClass(YearGrouping.class);
job.setReducerClass(WeatherReducer.class);

FileOutputFormat.setOutputPath(job, outputPath);
boolean success = job.waitForCompletion(true);
Verified project codePython
SARIMA forecasting
Original Python excerpt used for monthly temperature and precipitation forecasts.